
At the time of writing, the trading price of ETH is $1790. Despite trying to sell within the $1800 price range, the altcoin encountered selling pressure, resulting in its decline. The current overhead resistance for Ethereum is $1810. If the altcoin surpasses this resistance level, it has the potential to trigger a rally in its price.
On the other hand, if the current price level experiences a decline, Ethereum is likely to further decrease to $1750 before reaching the $1700 price mark. The recent session saw a decrease in the amount of Ethereum traded, which is shown in red color, indicating a weak buying power.
Technical Analysis
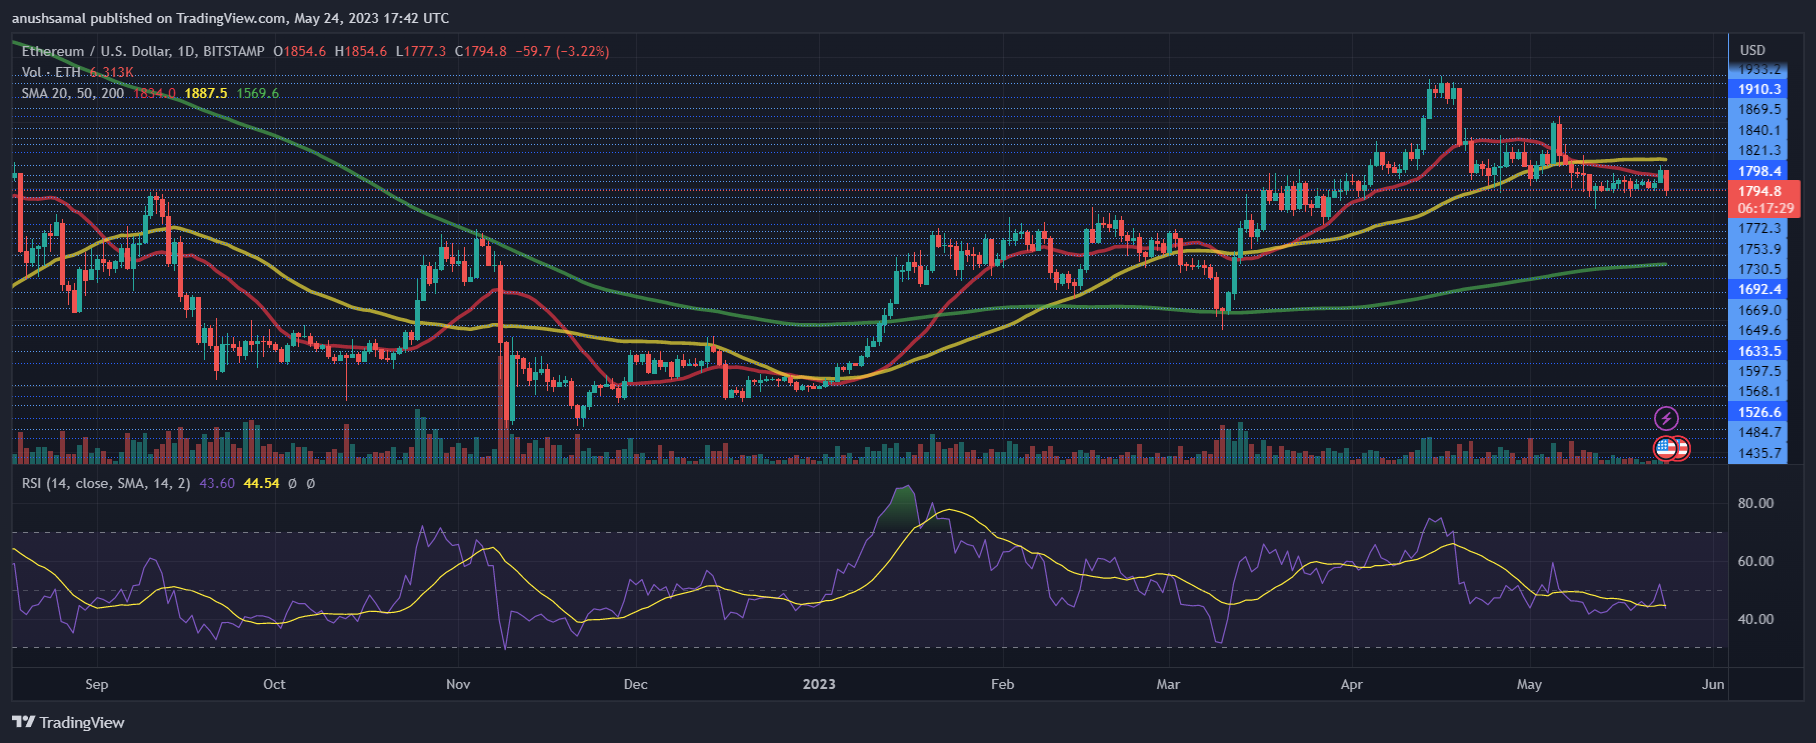
Throughout this month, Ethereum has experienced a decrease in demand, which has resulted in reduced buying power. The Relative Strength Index (RSI) has fallen below the midpoint line, suggesting reduced demand and increased selling pressure on the chart.
Additionally, the price of Ethereum has fallen below the 20-Simple Moving Average (SMA), indicating that sellers are dominating the price momentum in the market.
Given that the price movement of Bitcoin remains uncertain, many altcoins, including Ethereum, follow a similar price pattern. However, if Ethereum gains broader stability in the market, there is a possibility that demand may return, causing ETH to break above the 20-SMA line and potentially rise higher.
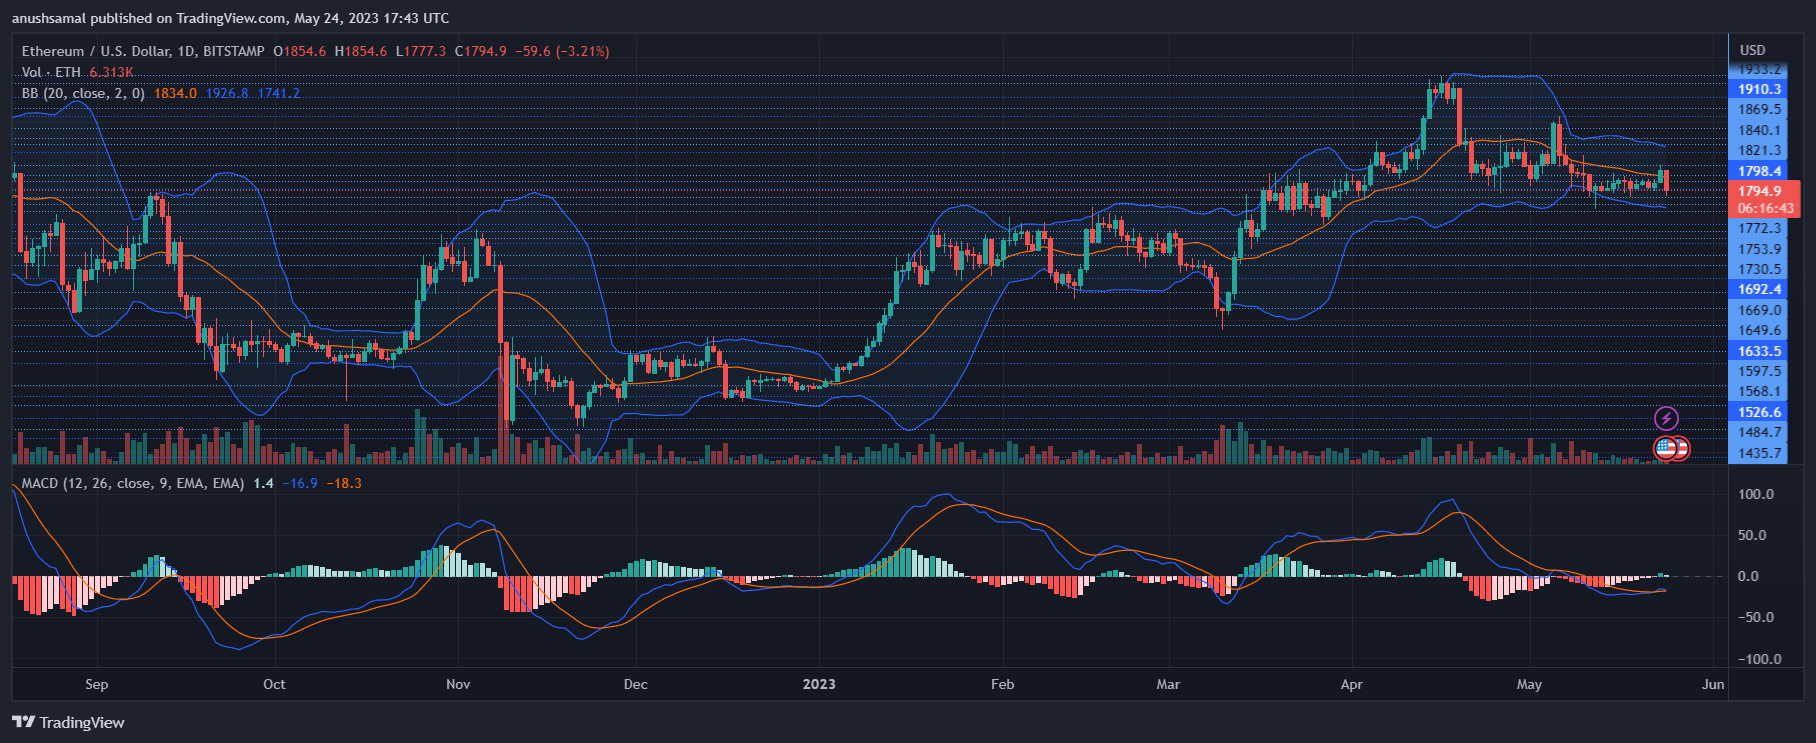
Due to the lack of demand, ETH is not showing significant buy signals. Moving Average Convergence Divergence (MACD), a tool used to indicate price momentum and potential trend reversals, shows small green histograms that do not provide conclusive buy signals at this point.
Bollinger Bands, which measure price volatility and potential fluctuations, maintain a parallel shape. However, they show little convergence, suggesting that ETH may be trading in a relatively stable range without much price change.
To recover the $1800 price level, it is important for buyers to re-enter the market at the current price level. Their participation is crucial for Ethereum to regain strength and potentially push the price higher.
Featured Image From UnSplash, Charts From TradingView.com